All rigorous AI Analysis needs a sturdy AI Analysis Lab. There is no better way to learn than to get hands on, so let’s get hand on. If you have not seen some of the practical examples in the Malice in the Mesh series, I highly suggest you go over there and check it out. They are the product of our AI Analysis Lab put to good use, and have crystallized the concepts discussed. We have gone from theory to practice, and this multi-part walkthrough is the recipe for building the infrastructure to do so.
Our lab stack will consist of these tools:
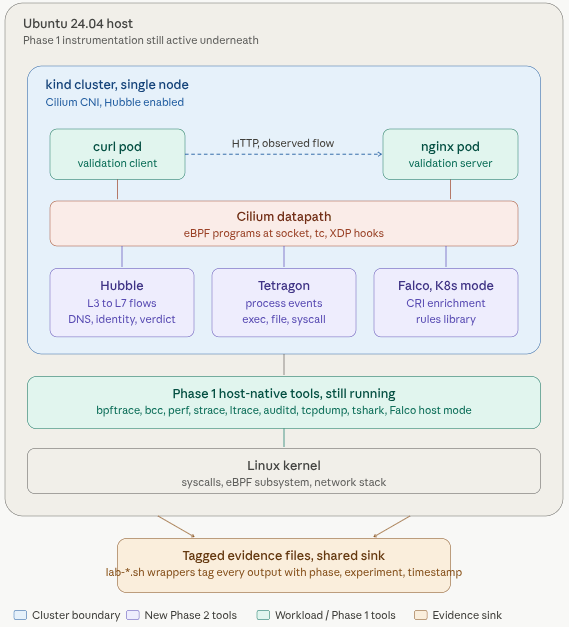
Layer 0a: Host-native observability
eBPF and Linux tracing toolkit. Installed in Phase 1, used in nearly every later phase.
- bpftrace: high-level eBPF tracing language. Custom scripts for
execve,openat,connect,write,clone. - bcc-tools (bpfcc): pre-built eBPF utilities. The blueprint specifically wraps
execsnoop-bpfcc,opensnoop-bpfcc, andtcpconnect-bpfccintolab-*.shhelper scripts. - perf: kernel performance counters and sampling profiler. CPU profiles during inference.
- strace: syscall tracer. Wrapped as
lab-strace.sh - ltrace: library call tracer.
- auditd: kernel audit subsystem for file access and
execvemonitoring; persistent rule-based logging. - bpftool: inspect loaded eBPF programs (validates Falco modern_ebpf driver is loaded).
- tcpdump: packet capture, wrapped as
lab-tcpdump.sh. - tshark : Wireshark CLI dissector for parsing pcaps
- ss: socket listing.
- /proc filesystem: process inspection (
/proc/<pid>/environ, etc.). - Falco (host mode): runtime security with the
modern_ebpfdriver.
Layer 0b: Kubernetes observability substrate
- Docker: container runtime under kind.
- kind: Kubernetes-in-Docker for the lab cluster (3 nodes: 1 control-plane + 2 workers).
- kubectl: cluster CLI.
- Helm: chart-based installs for Cilium, Tetragon, Falco.
- Cilium: eBPF-based CNI (replaces kind’s default CNI).
- Cilium CLI: install and status management.
- Hubble: Cilium’s flow observability layer (pod-to-pod flows, DNS, TLS/JA3).
- Hubble CLI and Hubble UI: flow inspection.
- Tetragon: eBPF-based process and file event tracing in Kubernetes; uses
TracingPolicyCRDs. - tetra CLI: Tetragon’s command-line client.
- Falco (Kubernetes mode): runtime security inside the cluster.
Layer 1: Model gateway
- LiteLLM: the single observable entrypoint for all frontier-model requests. Also serves as the front-end for local models in Phase 9.
- PostgreSQL: metadata persistence for LiteLLM, reused by LangGraph for checkpoints.
Layer 2: Frontier model path
- Anthropic API (Claude): locked frontier provider, reached via LiteLLM.
Layer 3: Tool protocol boundary (MCP)
- MCP Python SDK (
mcp): installed into the lab venv to build both transports. - Custom stdio MCP server: built in-lab.
- Custom network MCP server: built in-lab (HTTP transport).
- FastMCP: cloned for repo analysis in Phase 6.
- python-sdk (official MCP): second analysis target repo in Phase 6.
RAG / memory extension stack
- ChromaDB: vector store (pinned around FastAPI <0.132 due to a wire format regression).
- sentence-transformers / HuggingFace embeddings: embedding model.
- FastAPI, httpx, uvicorn: service stack underneath Chroma.
The construction of our lab is purposeful, one phase building upon the last and laying the groundwork for the next.
Phase 1 and 2 turns a Ubuntu 24.04 box into an observability station where we can drop anything into the middle and collect telemetry. Every tool has a validation test that proves it works on a known good process before any AI workload exists. At these phases is where we deploy Layer 0a and Layer0b from above.
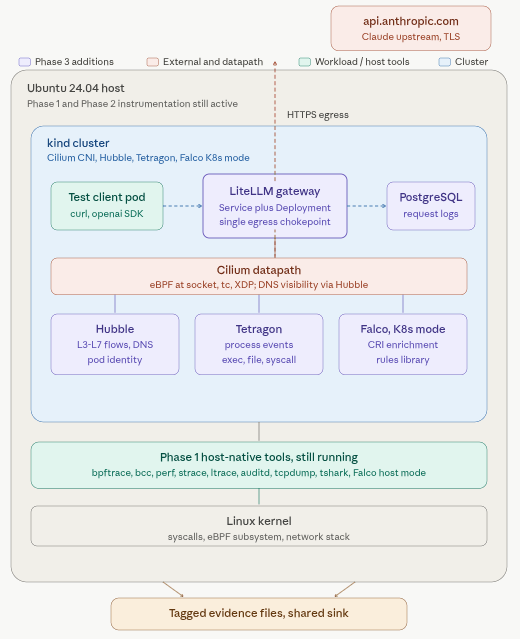
Phase 3 is where we configure the gateway. LiteLLM deployed in cluster, backed by PostgreSQL, with Claude API. The gateway becomes the single chokepoint through which every future model call flows, which is what makes correlation possible later.
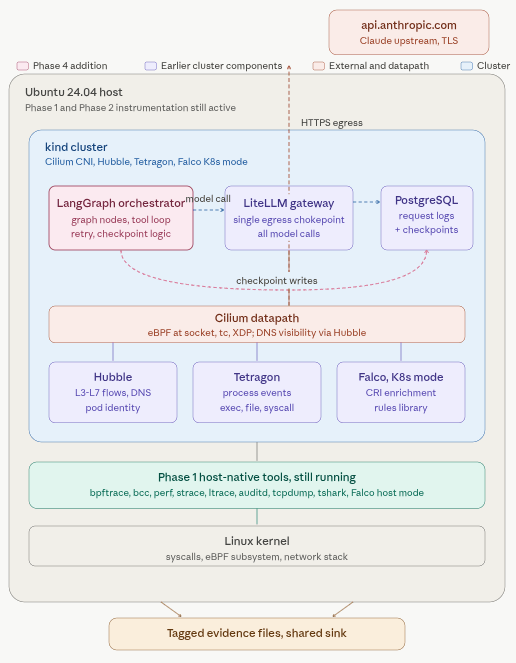
Phase 4 is where we set up the orchestrator. LangGraph wired to LiteLLM for model calls and to the same Postgres for checkpoint persistence.
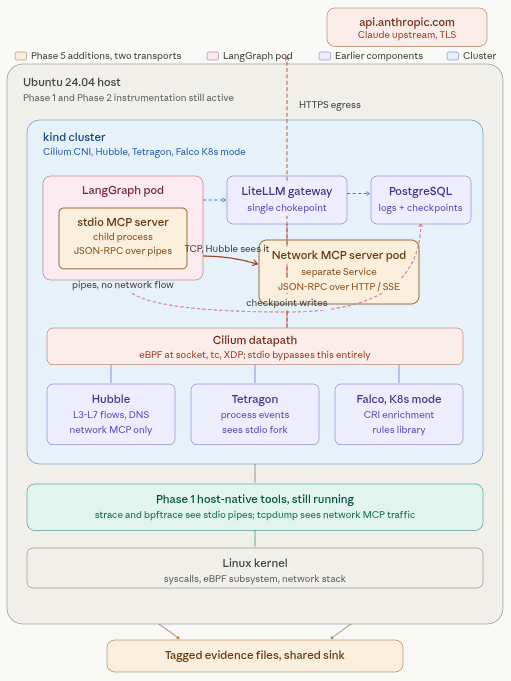
Phase 5 is the tool boundary. We build one stdio MCP server and one network MCP server.
Now we begin to drop real subjects into our lab for analysis.
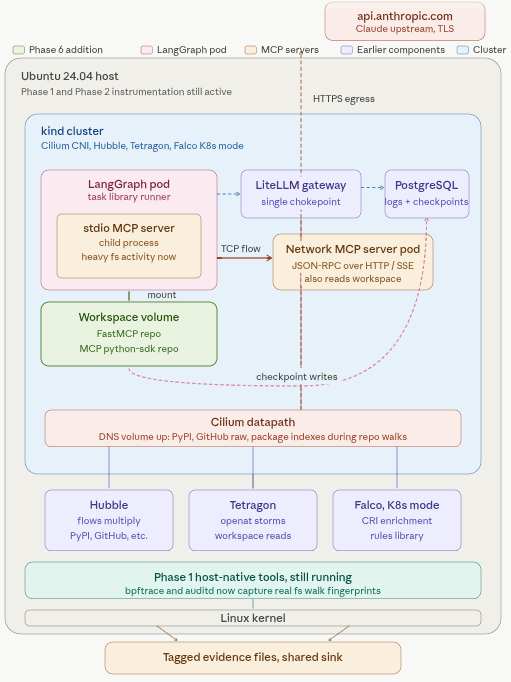
Phase 6 mounts real repos. FastMCP and the official MCP python-sdk, and builds a task library against them: map repo structure, find entrypoint, read depositories, run tests, read README. Then it wraps those tasks in a LangGraph agent and runs the whole thing under full instrumentation. Now you’re capturing the syscalls and network egress that happen when an agent actually walks a real codebase.
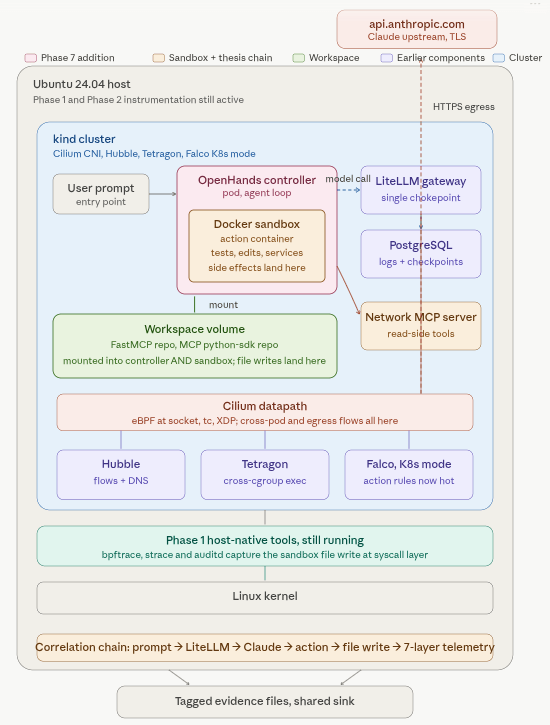
Phase 7 is the real meat. We add the sandbox action layer: OpenHands in Docker sandbox mode, model calls routed through LiteLLM to Claude, real repos mounted into the workspace. Action tasks now include things that have side effects: running tests, making code changes, starting local services.
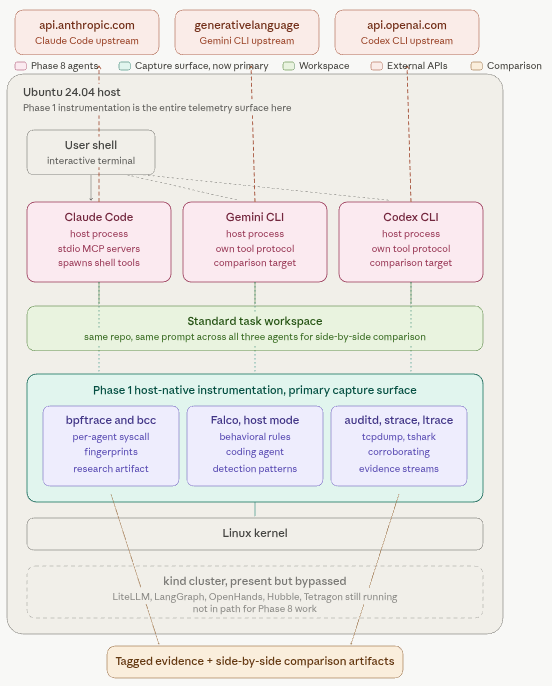
Phase 8 points the host-native instrumentation at coding agents running directly on the OS. We capture syscall fingerprints with bpftrace, write Falco rules that detect coding-agent behavior patterns, and compare agents side-by-side using a standard task.
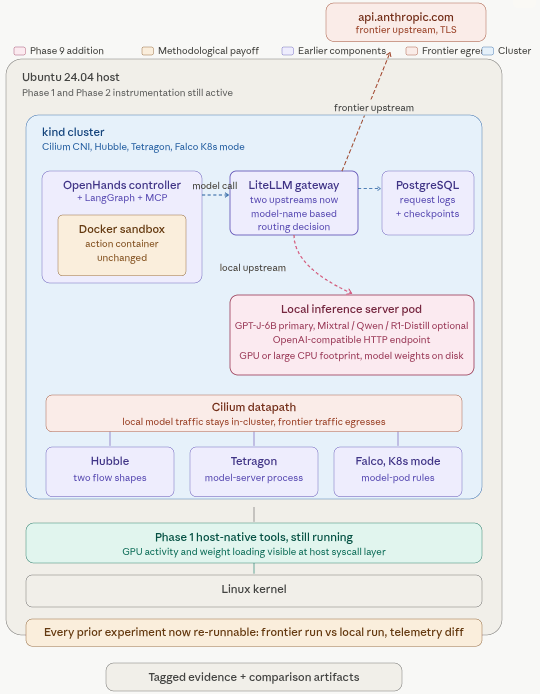
Phase 9 adds local model serving: GPT-J-6B registered in LiteLLM as just another upstream, which means every exercise from Phase 4 onward can now be re-run against local instead of frontier and the telemetry compared directly.
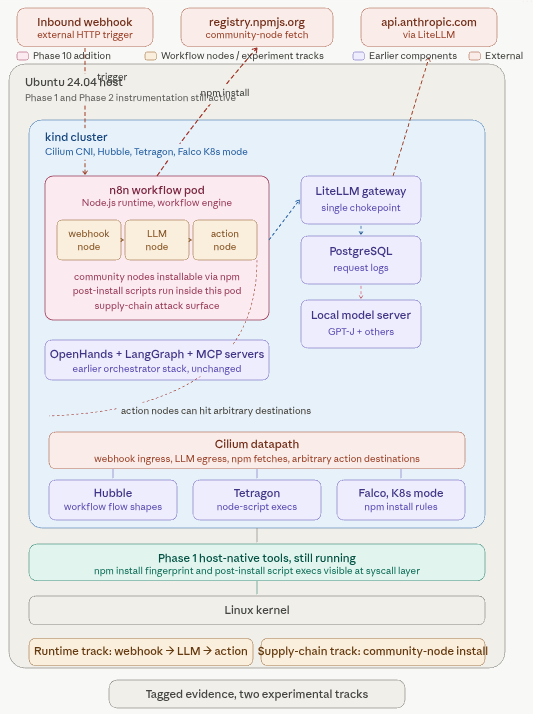
Phase 10 adds n8n as the first workflow-builder target, with a webhook to LLM to action workflow studied at the network and process layers, plus community-node installation as a supply-chain study.
Come back for the next installment where we will dive into the first phase.